

Getting Started
Here is an overview of the tool’s general functionality:

Take the Survey
Enter your data to the best of your knowledge in the SIMA Benchmark Survey, this is not necessary but highly recommended.


Check Results
Once you have successfully submitted a survey, you can view the dashboard with your contribution. In the right-hand corner of the dashboard, you will see a count of the number of surveys that have been submitted and how many companies are included in the benchmark data.
If you don't notice the number go up by at least one, refresh your page to update the data.
Apply Filters
*Please keep in mind that any filter applied will alter the entire benchmark dashboard and the count will adjust as you filter.
The first section displays filter options that you can use to customize the data shown. You will notice that all options under these dropdown boxes are already checked.
This is indicative that all data is currently visible within the dashboard.
- To select your desired filter, deselect all options by clicking the checkbox at the very top of the dropdown menu.
- Next, click your desired check box, then click outside of the dropdown menu.
- This will activate your selection and update the dashboard. You should see your selected data after a few seconds.
Filter Types:
Company Annual Revenue – The range of revenue where your company falls in the current year.
Company Profitability – The profitability range that your company falls within.
Years of Operation – The range of the number of years your company has been operation in the snow and ice industry.
Company Structure – Describes the structure of your company’s snow & ice services.
- Aggregator – all or most services are executed by a network of local operators.
- Self-Performing – all or most services are executed by the firm’s own workers.
- Hybrid – operations are run by a mix of the firm’s own workers or a network of local operators, depending on location.
If you want to clear filters, click 'Clear Filters' at the top right. You will be redirected to the Google Looker Studio version of the benchmark dashboard.
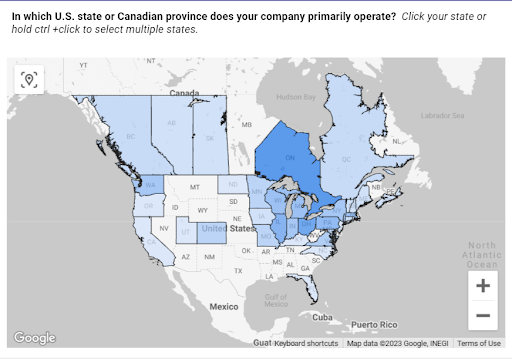
Map Navigation
The map visual will allow you to filter the state or Canadian province does your company primarily operates in by simply selecting that state or province. You can Click your state/province or hold ctrl +click to select multiple states/provinces.
As you navigate the Snow & Ice Industry Economic Benchmark Dashboard, to deselect any area you have clicked, click it again to remove any filters. For instance, if you click the state of Wisconsin on your map, simply click Wisconsin again to view all data again. At any time you can also click the Clear Filter button at the top to reset the dashboard.

Download
View the Dashboard in Google Looker Studio.You can view the Snow & Ice Industry Economic Benchmark Dashboard in Google Looker Studio. Here, you can access additional features such as the reset option (clear dashboard filters) and the ability to download the dashboard as a PDF file.
To Download a benchmark report. View or edit the report you want to download.
- Apply any refinements available in the report, such as filter controls, date range controls, or data controls.
- In the upper right, click Share, then click Download.